
 Contact us


Product details
IT system monitoring is becoming a critical requirement for enterprises operating hybrid IT infrastructure, multi-cloud, and digital applications. As systems become increasingly distributed, using multiple disparate monitoring tools makes it difficult for IT teams to see the complete picture. This also slows down incident detection and response processes.
The Comprehensive IT System Monitoring Solution integrating AIOps with LogicMonitor helps enterprises consolidate monitoring, analysis and operational automation on a single platform. Through the LM Envision platform, LogicMonitor provides SaaS-based Observability capabilities. This platform supports anomaly detection, alert noise reduction, root cause analysis and accelerated incident resolution.
This is a suitable choice for organizations looking to modernize IT system monitoring operations, optimize hybrid IT operations, and enhance resilience in the AI era.
LogicMonitor in modern IT system monitoring
LogicMonitor was founded in 2007 and is headquartered in Santa Barbara, California, USA. The company provides a SaaS-based Observability platform, focused on hybrid IT environments.
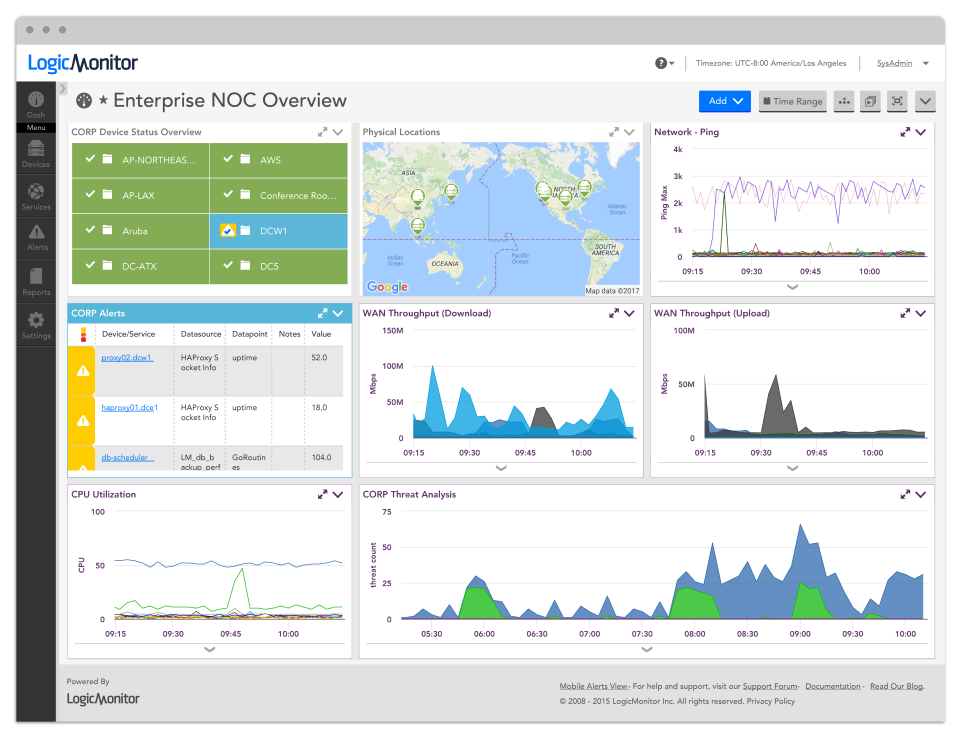
LogicMonitor supports enterprises in monitoring multiple infrastructure layers. These components include on-premises systems, multi-cloud, networks, servers, cloud services, Kubernetes, and IoT.
Instead of operating multiple separate tools, enterprises can consolidate operational data into a unified platform. This enables IT teams to view, analyze, and proactively handle incidents across the entire system.
LM Envision – IT system monitoring platform integrating Observability and AI
LogicMonitor's flagship platform is LM Envision. This is a Unified, AI-powered Hybrid Observability platform designed to monitor the entire IT stack on a unified interface.
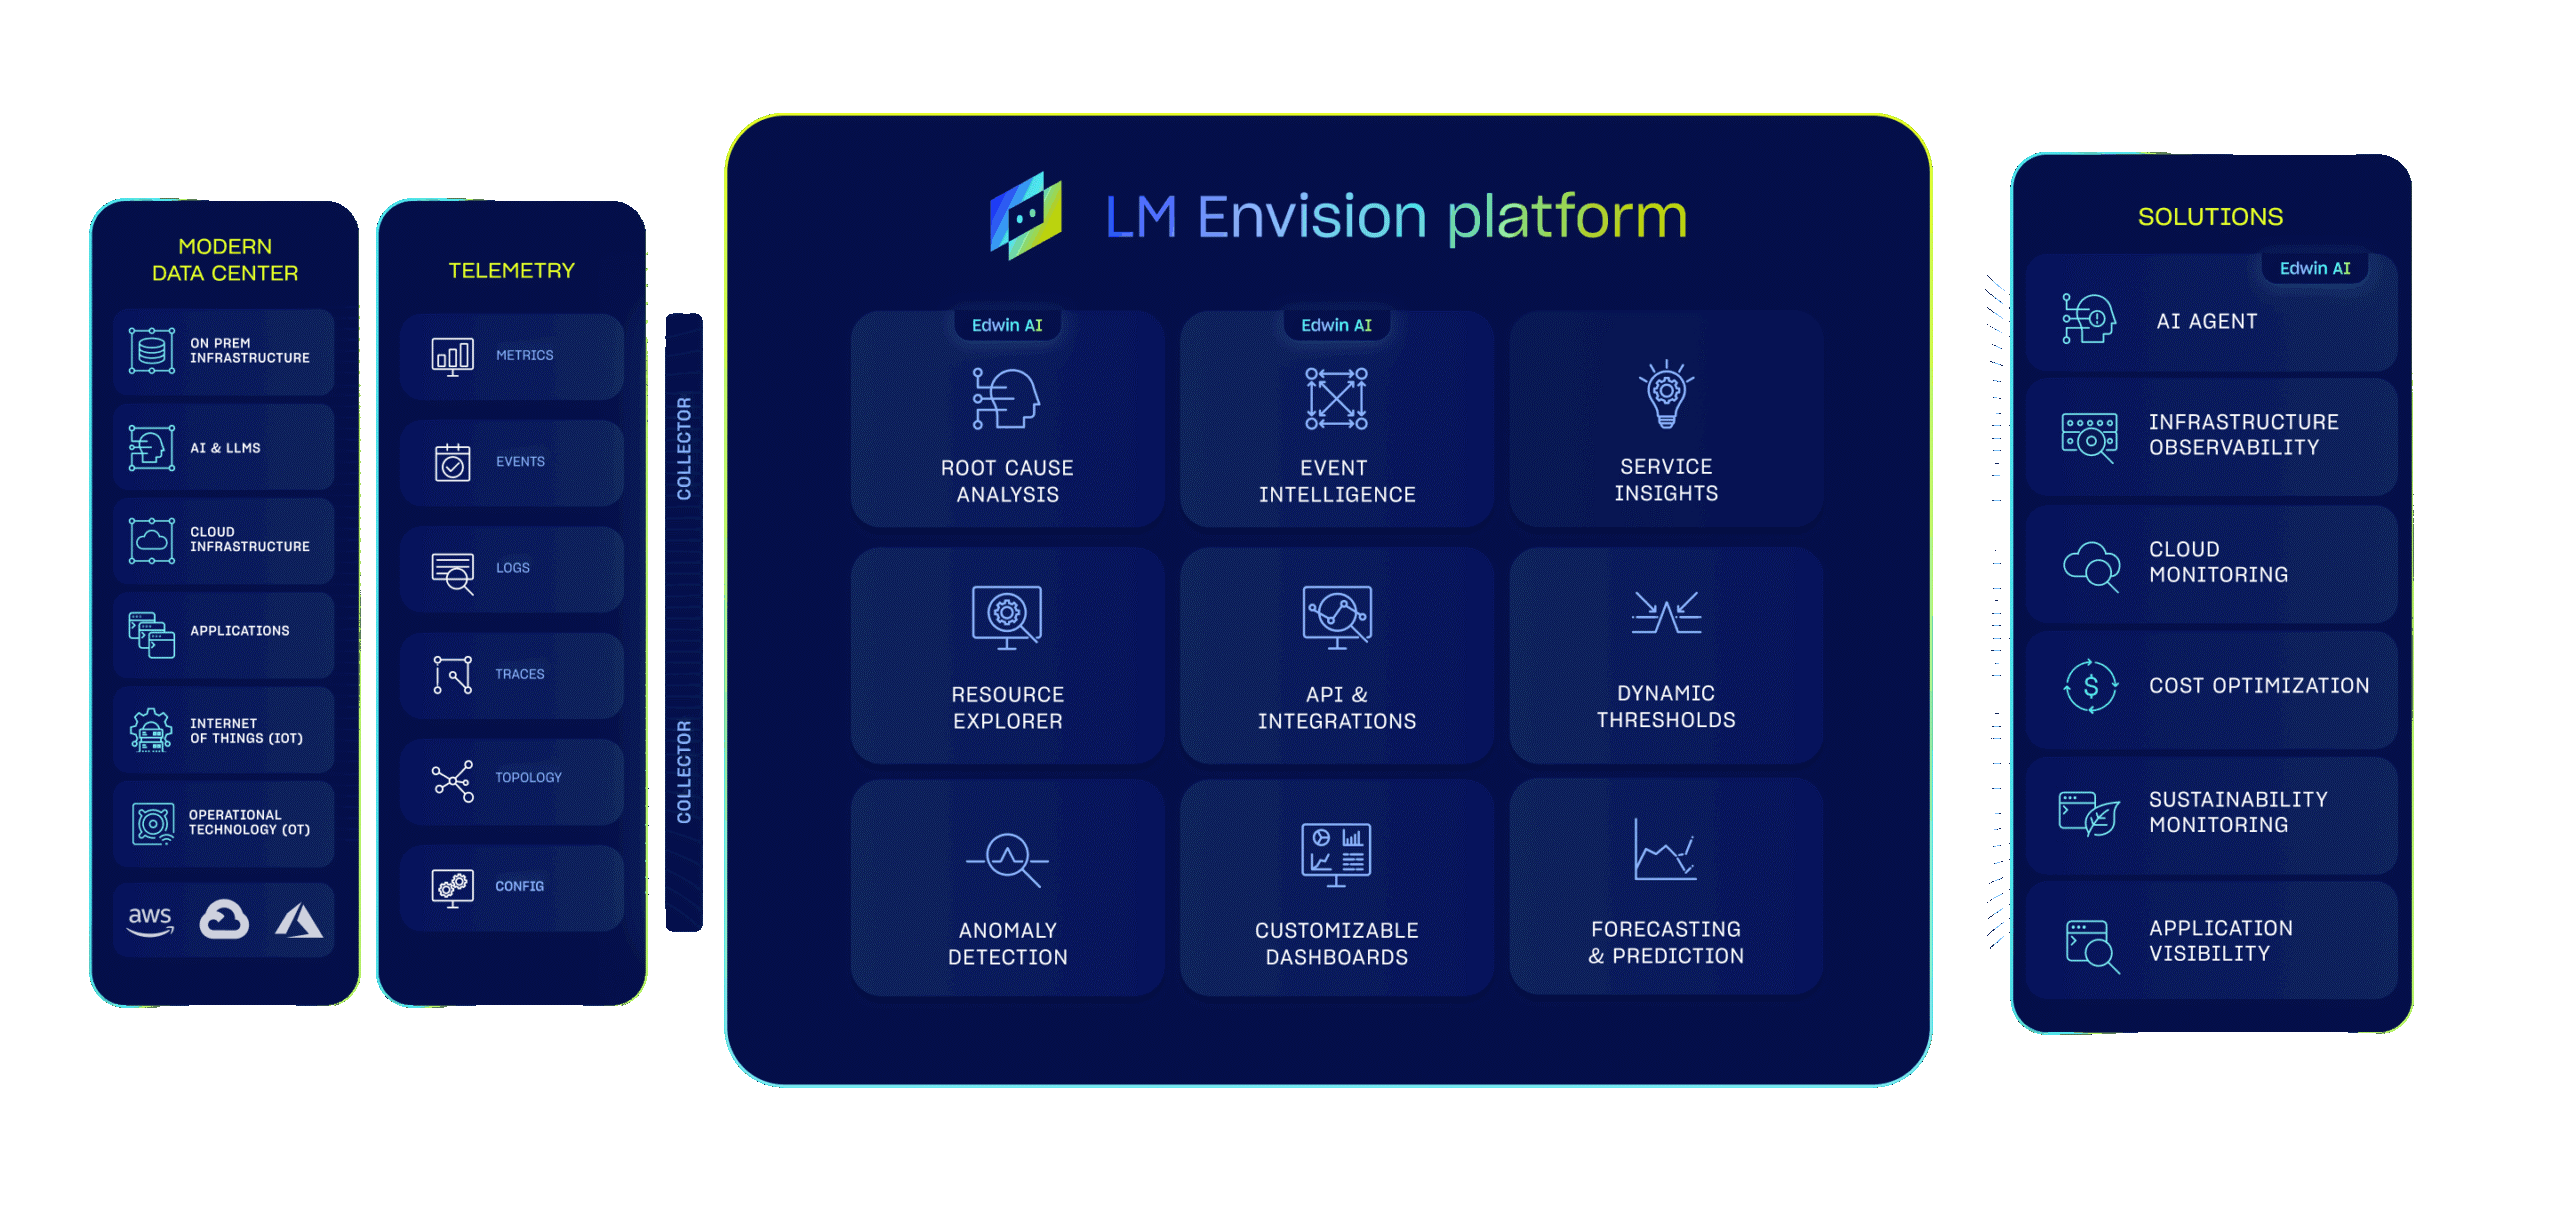
LM Envision helps enterprises:
- Comprehensive monitoring of IT infrastructure, cloud, logs, applications and digital experience.
- Automatically discover resources and collect operational data.
- Correlate data from multiple sources to support incident analysis.
- Apply AIOps to reduce alert noise.
- Detect anomalies before they affect users.
- Supports root cause analysis.
- Reduce incident response time.
- Enhance operational resilience in hybrid IT environments.
LogicMonitor's strength lies not only in monitoring capabilities. The solution also brings AI into IT operations. Thanks to this, IT teams can shift from passive response to proactive data-driven management.
Monitor IT systems and overall infrastructure
LogicMonitor Envision helps enterprises comprehensively monitor critical infrastructure components. These components include servers, storage, networks, databases, virtualization environments and cloud resources.
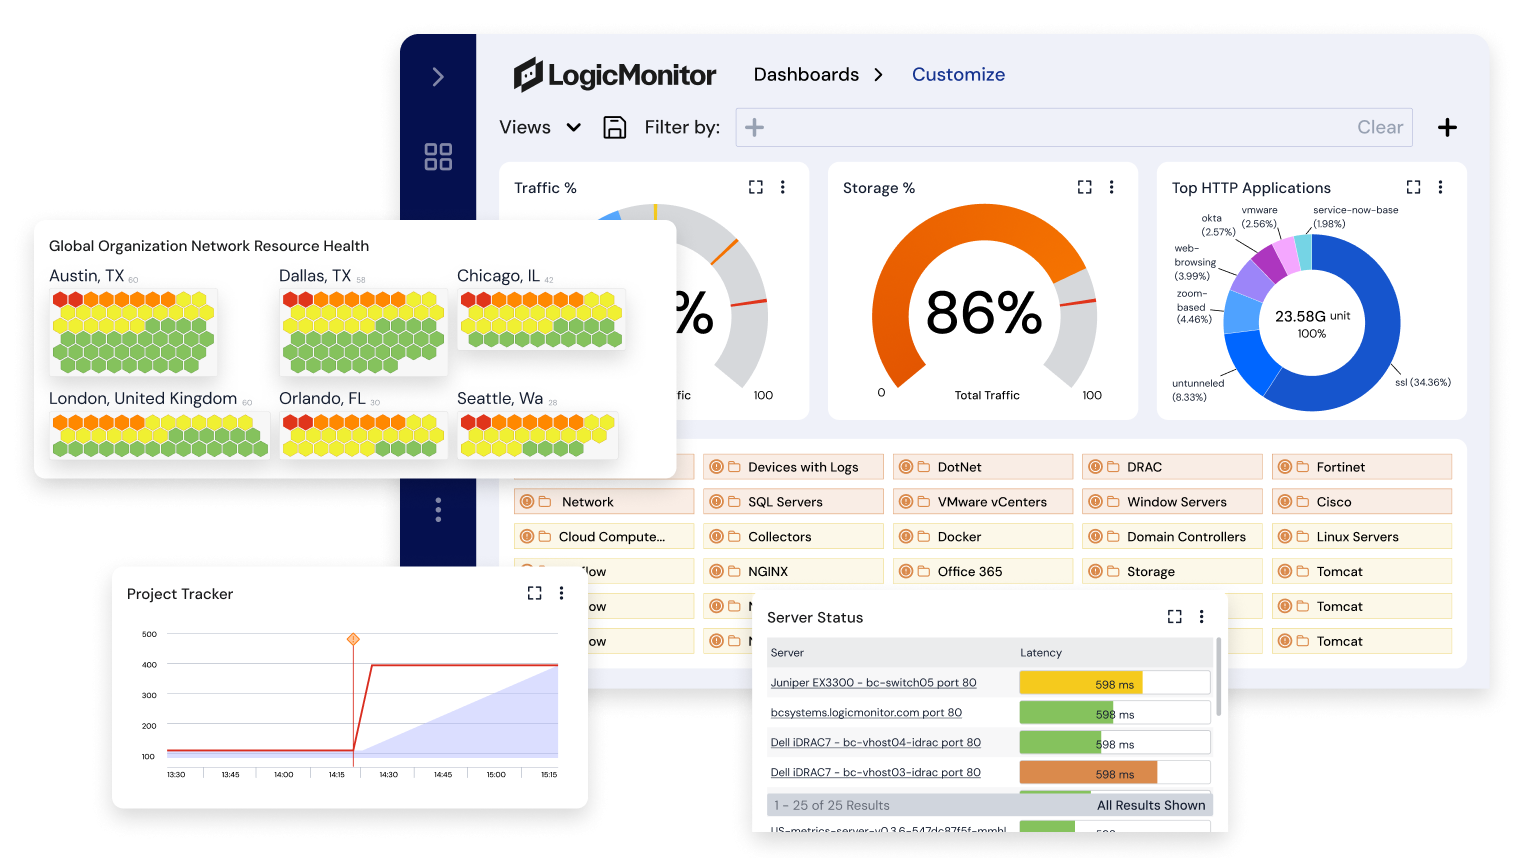
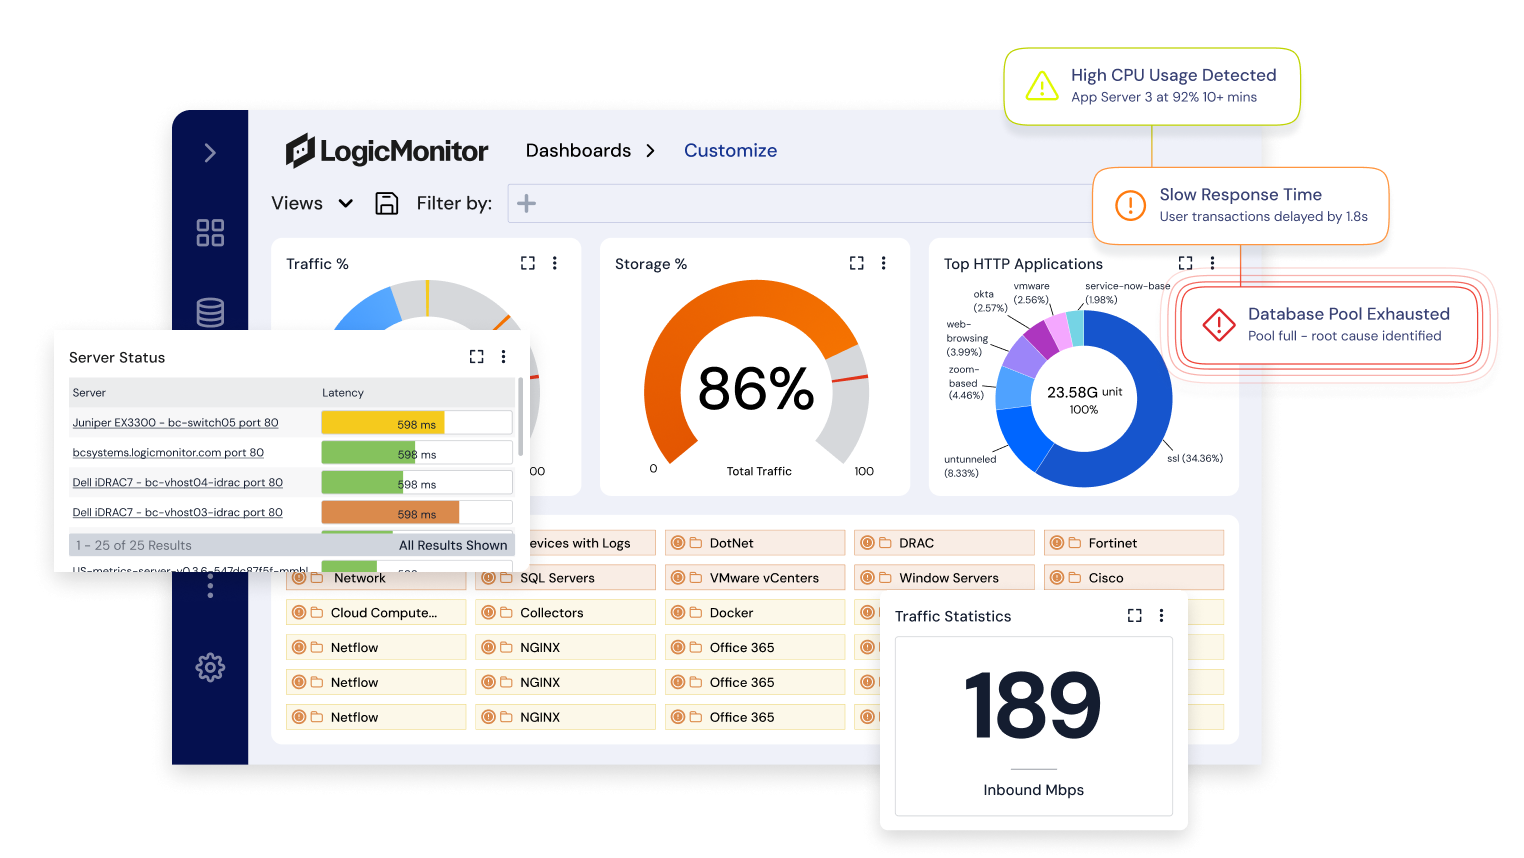
All data is consolidated on a single interface. IT teams can track performance, detect anomalies and coordinate incident response faster.
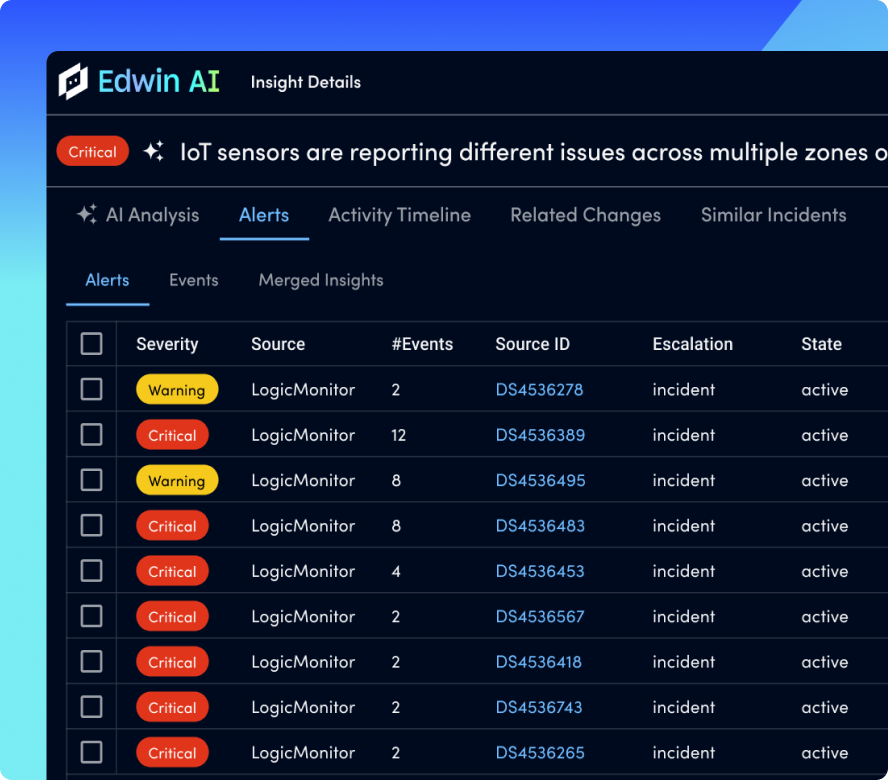
With AIOps powered by Edwin AI, LogicMonitor helps IT, ITOps, and CloudOps teams proactively manage performance. The solution also supports detecting issues before they impact users.
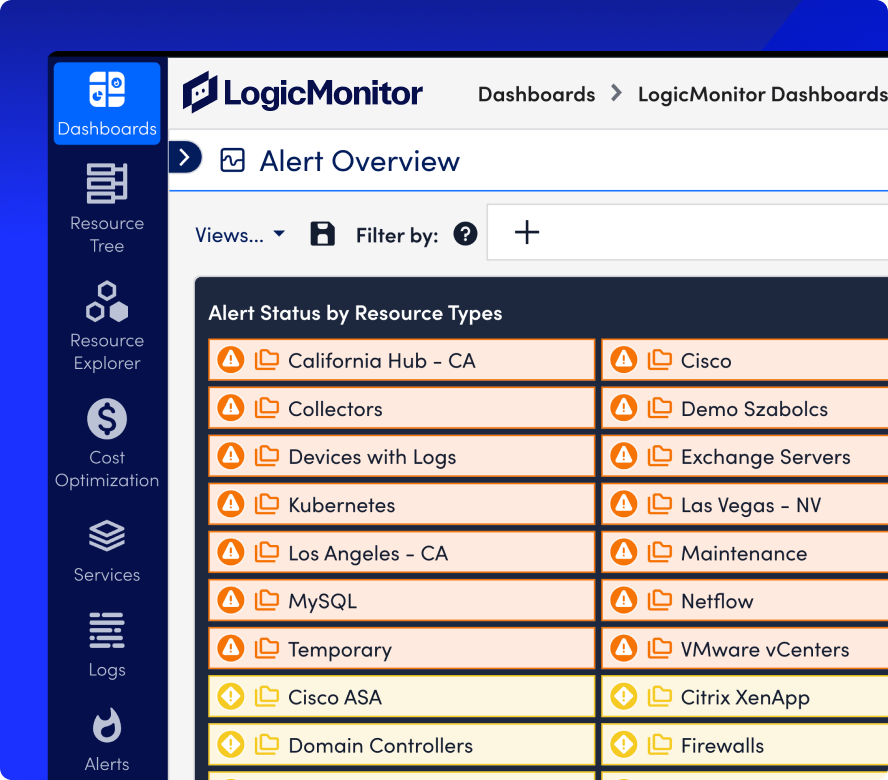
Highlights in infrastructure monitoring
Intelligent data collection:
LogicMonitor automatically discovers infrastructure with pre-built LogicModules. These LogicModules support servers, storage, networking and cloud resources.
Predictive analysis:
Edwin AI supports resource usage forecasting. The solution also detects anomalies before incidents affect services.
Unified control panel:
Key metrics are visualized on a single interface. This helps IT teams prioritize and resolve incidents faster.
Hybrid cloud ready:
LogicMonitor supports workload monitoring across data centers, private cloud, public cloud and multi-cloud.
Service-level context:
Infrastructure performance is linked to business services. As a result, enterprises can make faster decisions aligned with operational objectives.
Key infrastructure monitoring capabilities
Network monitoring
LogicMonitor helps eliminate blind spots on routers, switches and cloud networks. The solution provides real-time visibility into traffic, interfaces and device status.
Server monitoring
Enterprises can monitor the status and performance of physical servers, virtual servers in data centers and cloud environments.
Remote monitoring
LogicMonitor provides a comprehensive view of tools, connectivity, and applications serving remote work or hybrid work models.
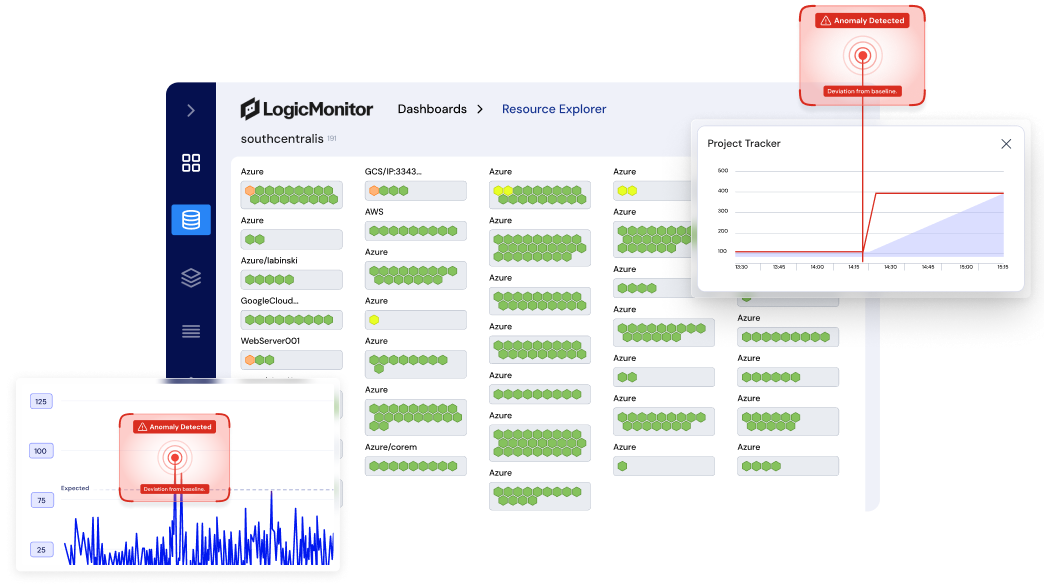
Virtual machine monitoring
The solution supports comprehensive monitoring of virtual machines and hypervisors. Supported platforms include vSphere, Hyper-V, Nutanix, and many other systems.
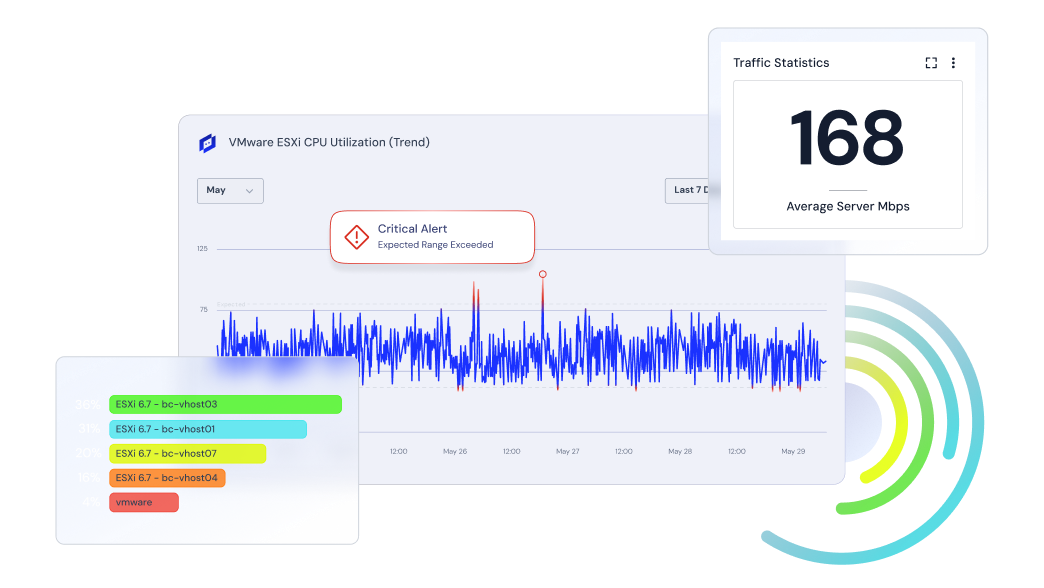
Giám sát SD-WAN
LogicMonitor monitors SD-WAN tunnels, edge devices and link status. The solution is suitable for multi-vendor network environments.
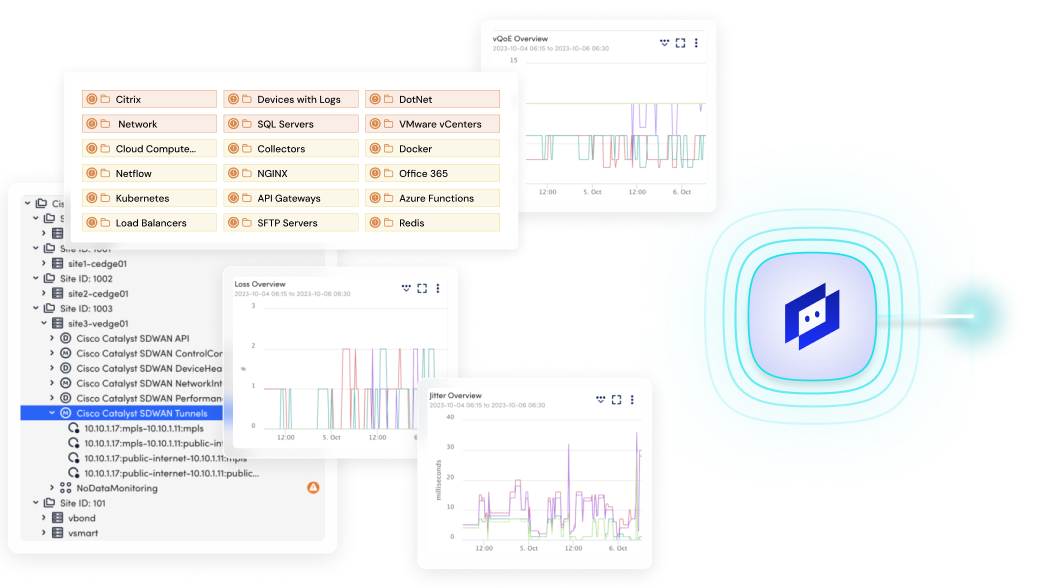
Database monitoring
Enterprises can monitor database status, query speed, and capacity trends. This helps applications operate stably and scale effectively.
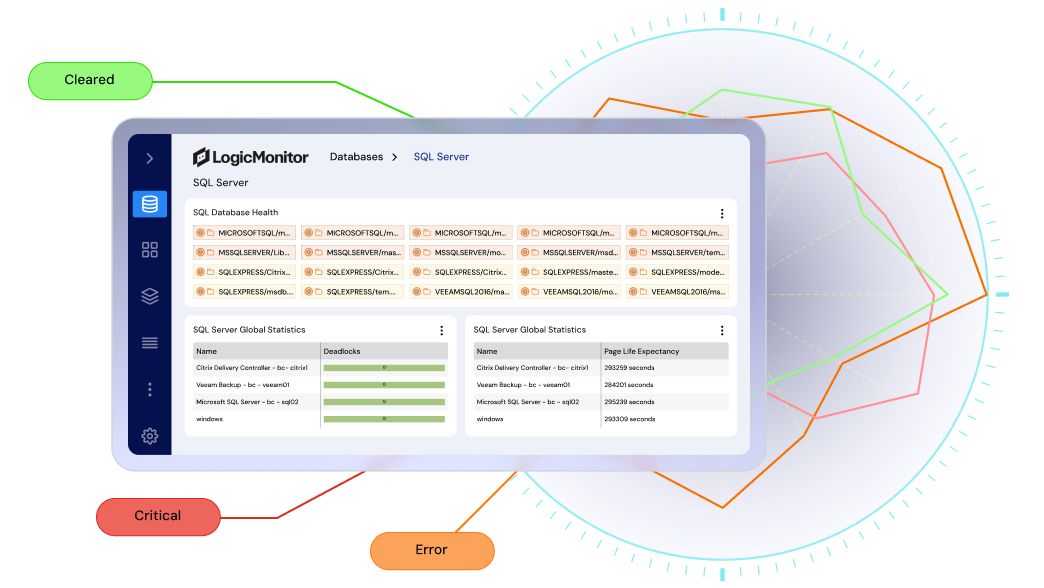
Storage monitoring
LogicMonitor monitors IOPS, latency and storage capacity on on-premises and cloud systems. As a result, enterprises can prevent bottlenecks.
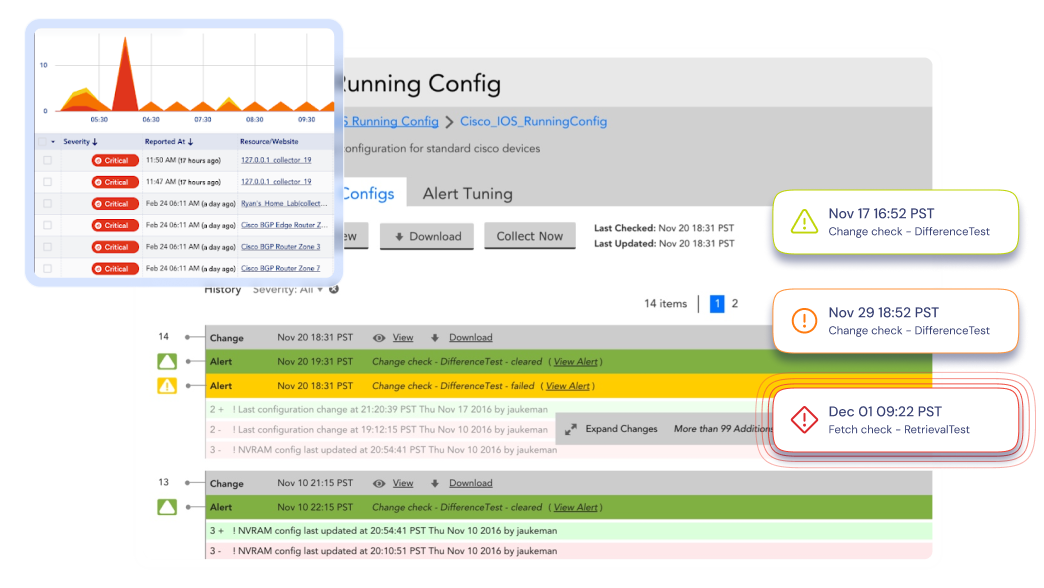
Configuration monitoring
The solution provides real-time alerts, complete configuration history, and performance correlation capabilities across the entire infrastructure.
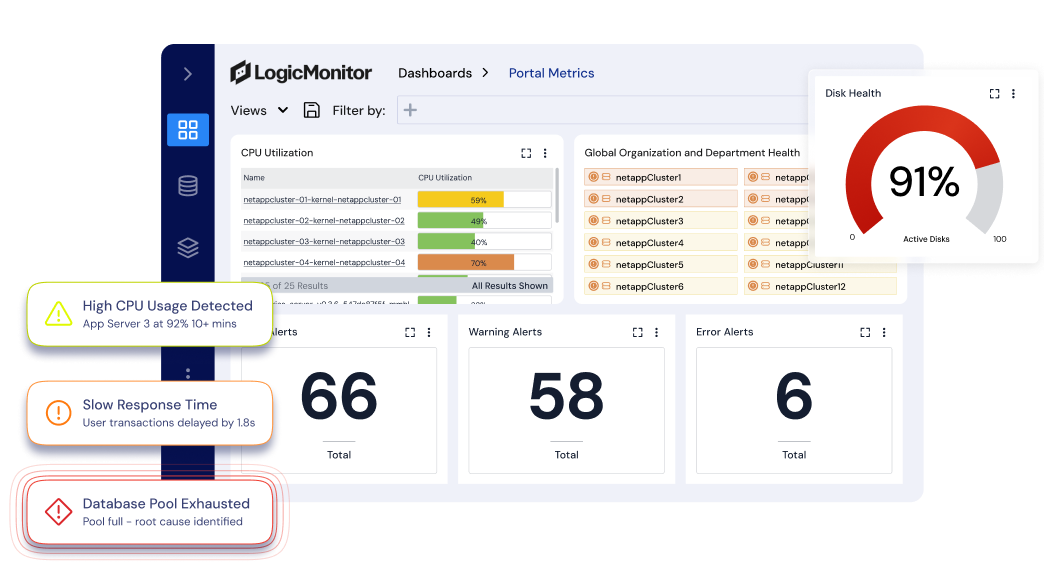
Benefits of IT system monitoring with LogicMonitor
LogicMonitor helps enterprises gain comprehensive visibility across physical, virtual, and cloud environments. With AIOps and predictive analytics, IT teams can detect anomalies earlier.
The solution also helps resolve incidents faster and minimize downtime. Consolidating monitoring tools helps reduce management costs. At the same time, enterprises can improve mean time to resolution and optimize resource utilization.
LogicMonitor's SaaS architecture helps enterprises scale flexibly. This platform also increases reliability and better meets operational requirements at large scale.
Monitor IT systems on cloud and multi-cloud
Cloud-native services help enterprises modernize applications and services. However, managing performance, availability, and costs on the cloud is becoming increasingly complex.
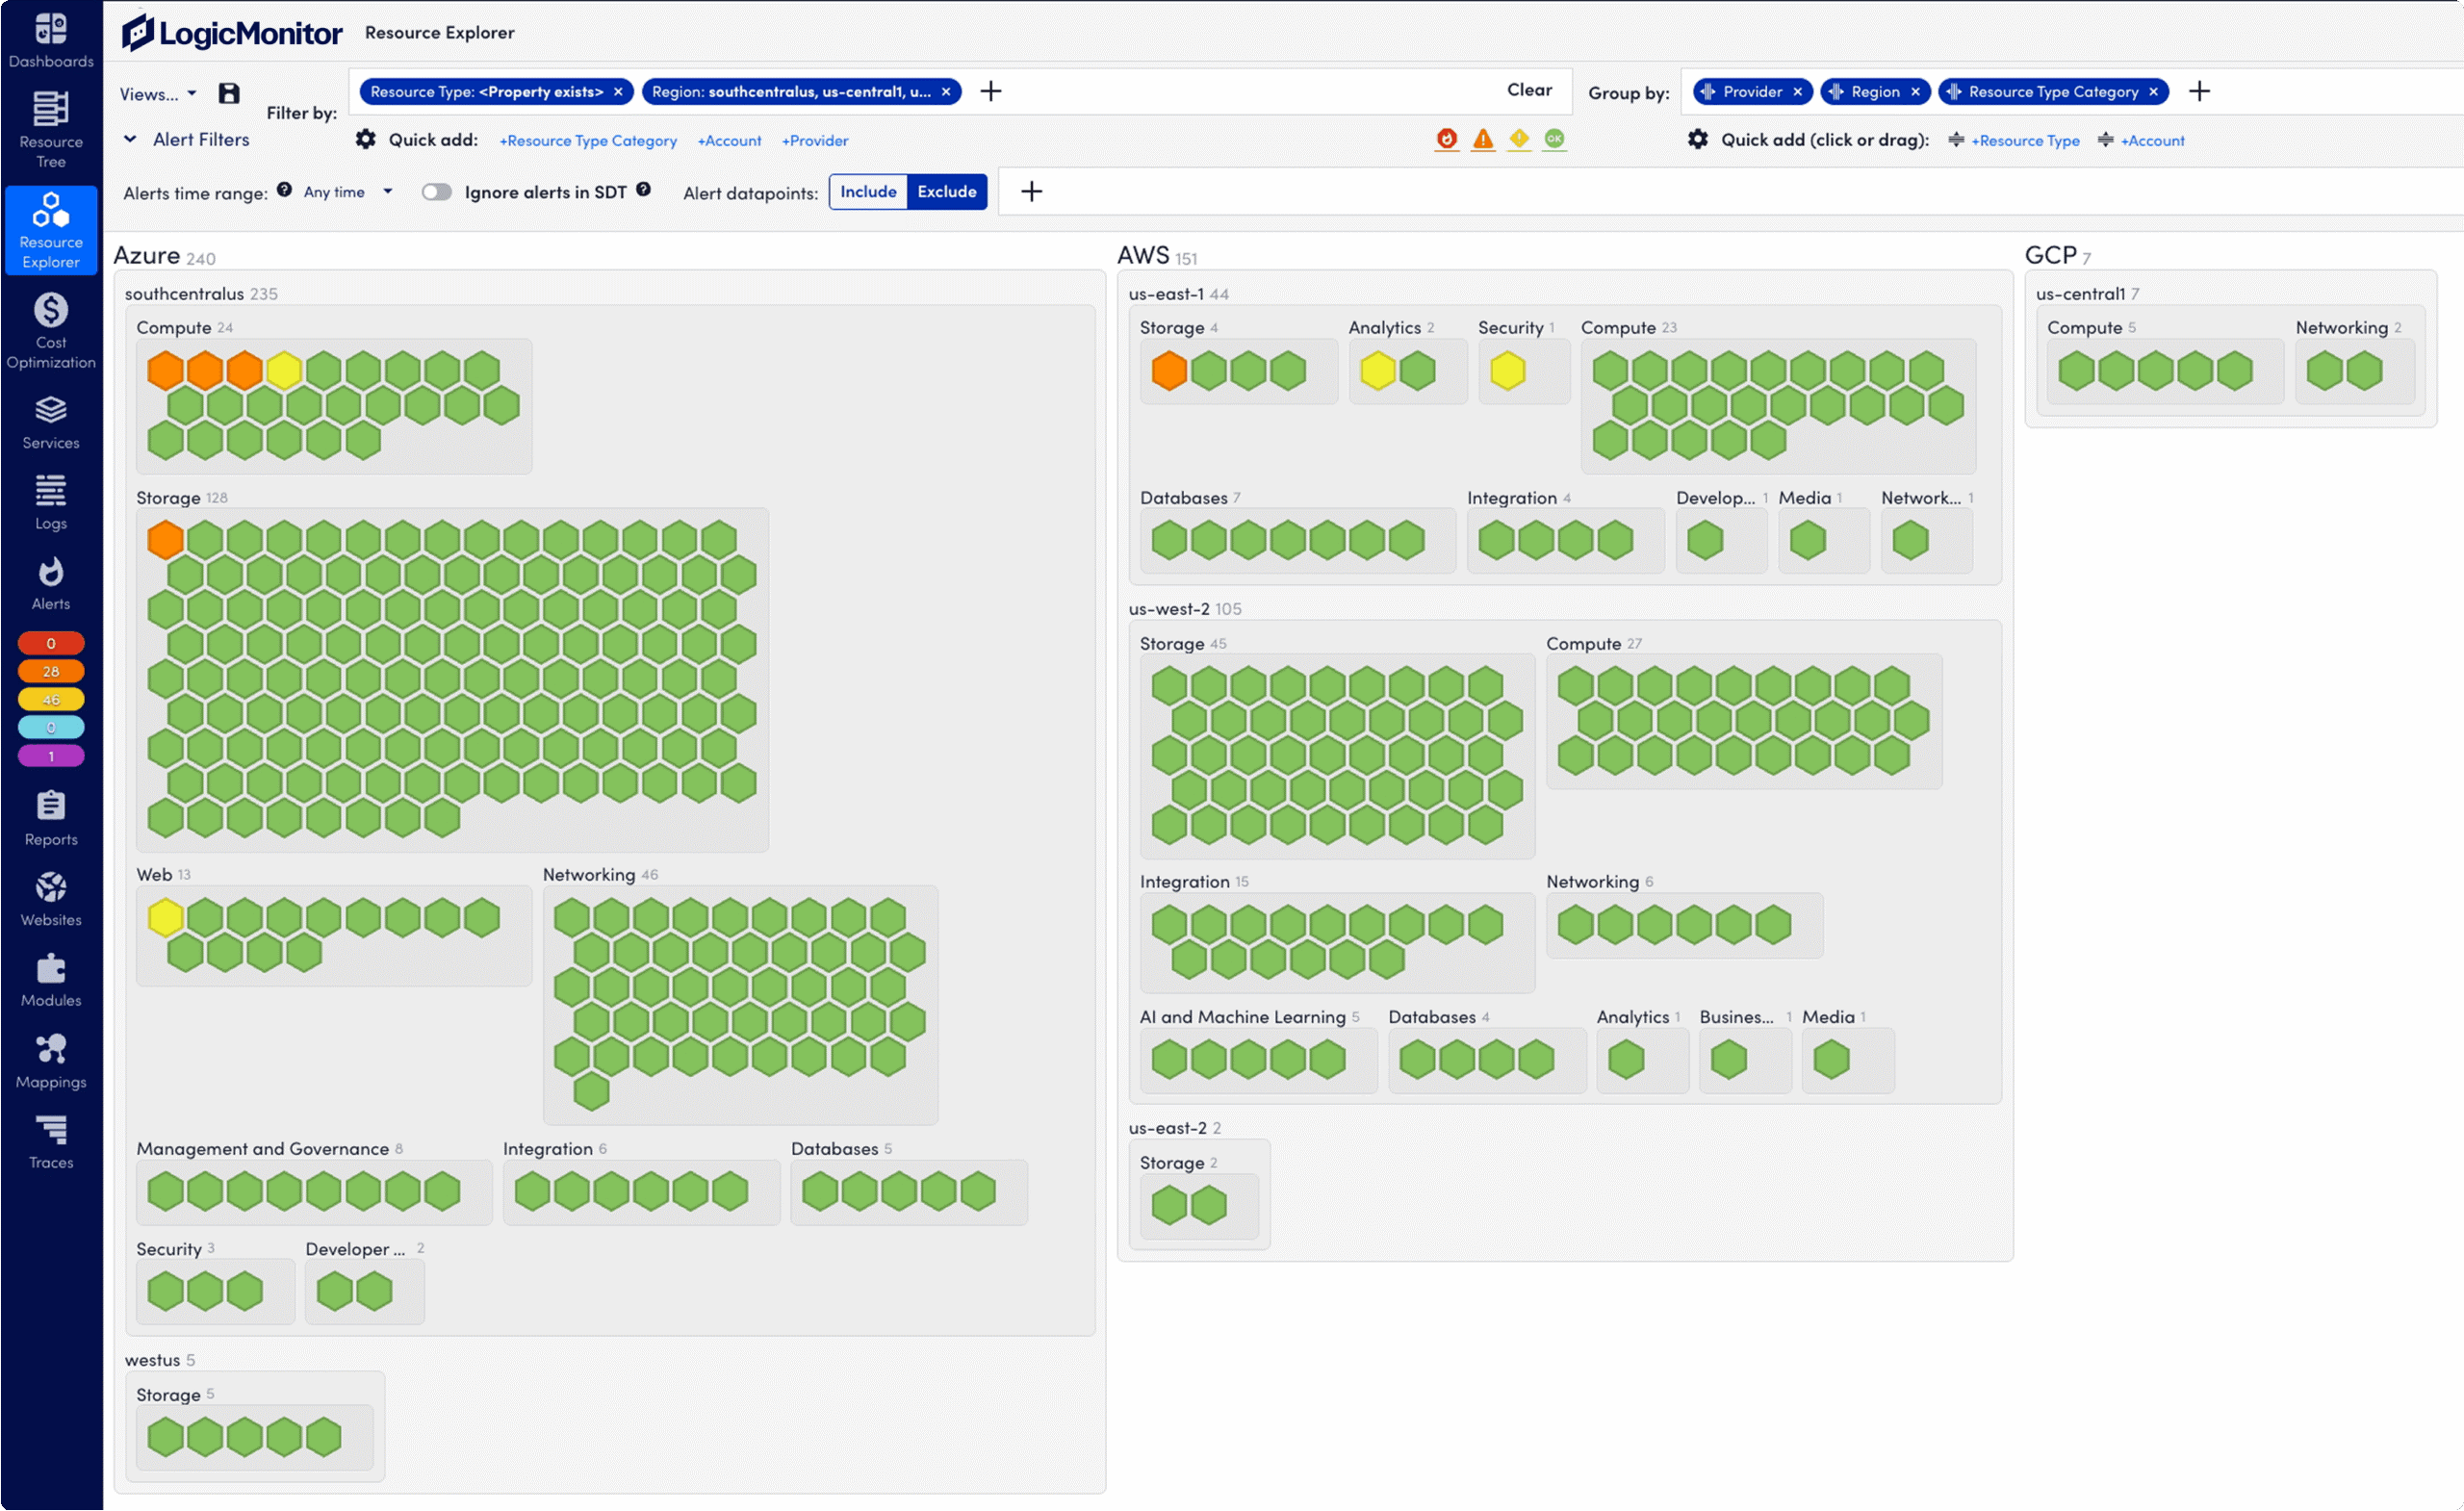
Enterprises often must operate AWS, Microsoft Azure, Google Cloud Platform, Oracle Cloud Infrastructure and on-premises systems in parallel. This creates multiple data layers and multiple monitoring points.
LogicMonitor Cloud Monitoring helps ITOps and CloudOps teams comprehensively observe cloud services, critical servers and AI workloads. Enterprises do not need to switch between multiple tools.
Highlights in cloud monitoring
Giám sát multi-cloud:
LogicMonitor supports AWS, Azure, Google Cloud Platform, Oracle Cloud Infrastructure and private cloud.
Flexible data collection:
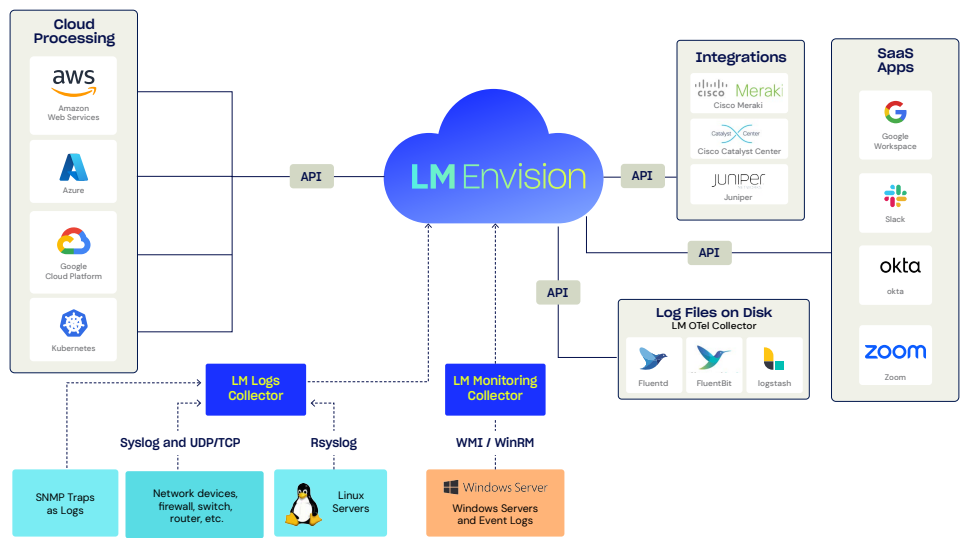
Solution for collecting cloud resource information through collectors and API integration.
Automatic detection:
New cloud resources can be automatically discovered and added to the monitoring dashboard.
Service-level detailed information:
LogicMonitor aggregates views of related resources. This helps monitor operational status at the enterprise level.
Combine logs, metrics, and traces:
Solution supporting remote measurement data. This enables IT teams to analyze root causes faster.
Proactive alerts:
Businesses can receive notifications before cloud incidents cause serious operational impact.
Key cloud monitoring capabilities
Giám sát container
LogicMonitor provides real-time visibility into clusters, pods, and services. This helps enterprises eliminate blind spots in container environments.
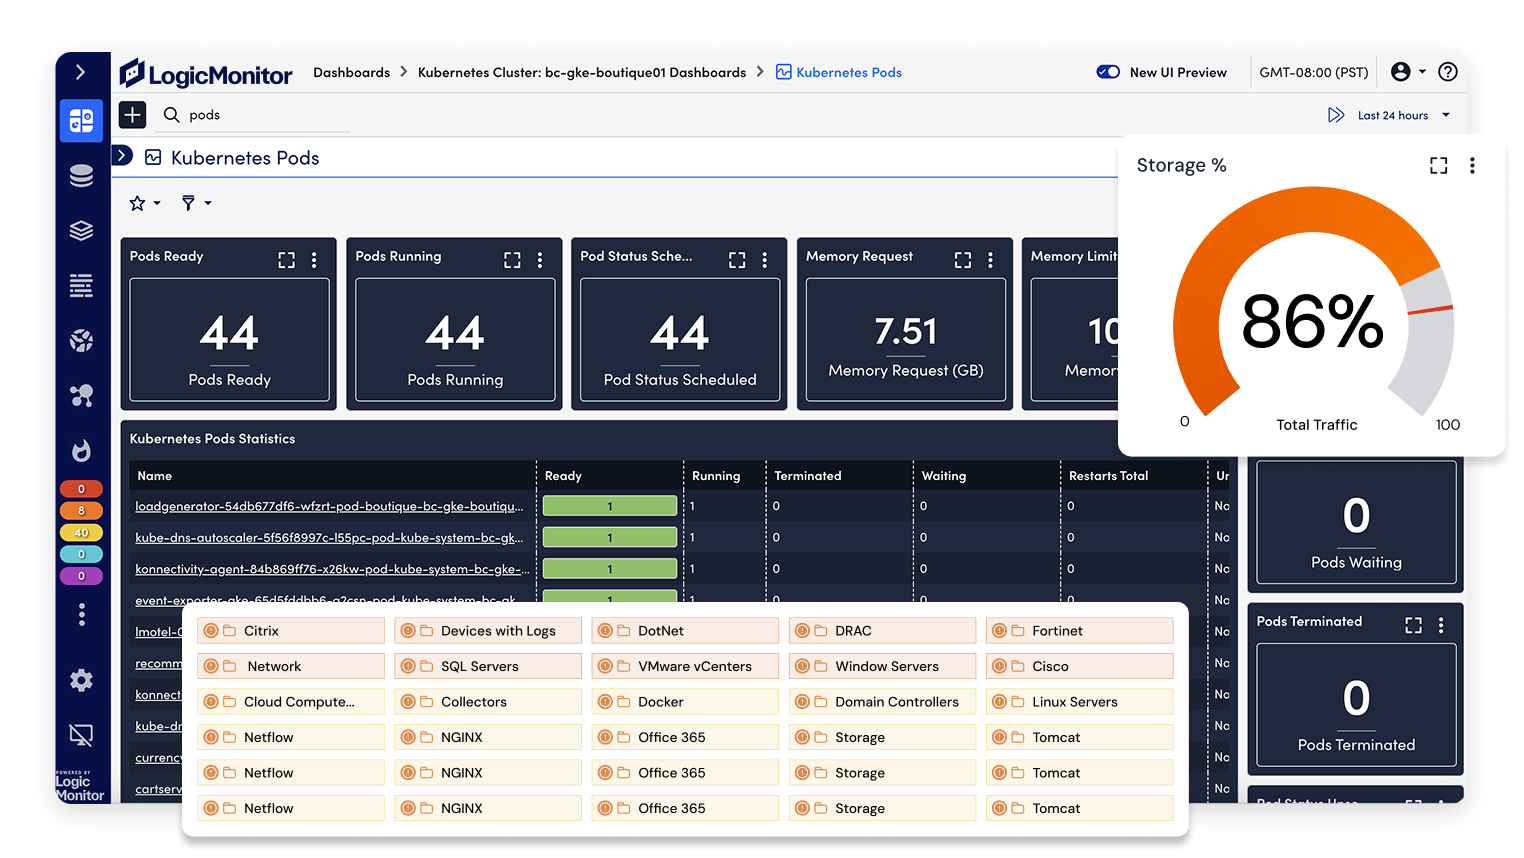
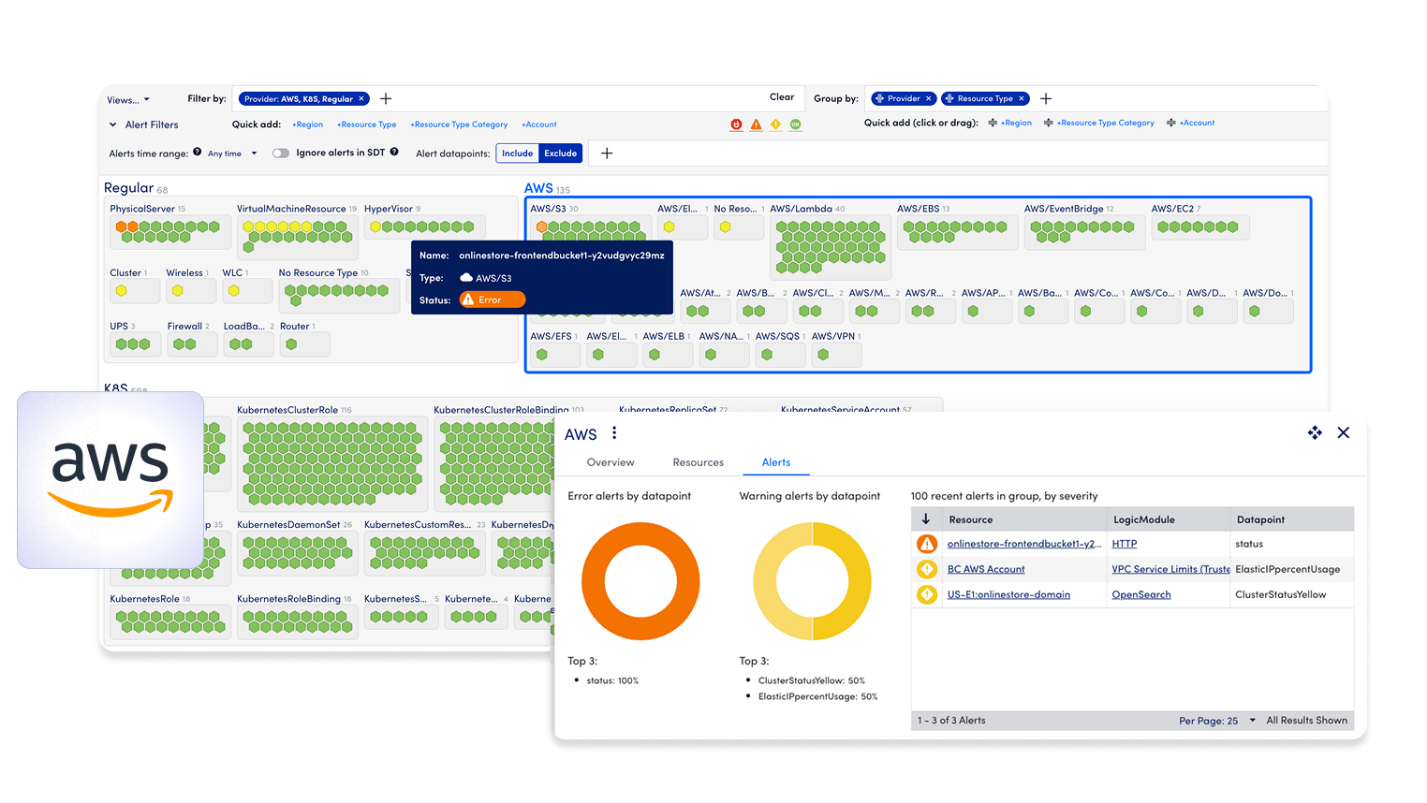
Monitor AWS in hybrid environments
LogicMonitor enhances the value of Amazon CloudWatch. The solution provides deeper visibility, faster insights, and fuller context.
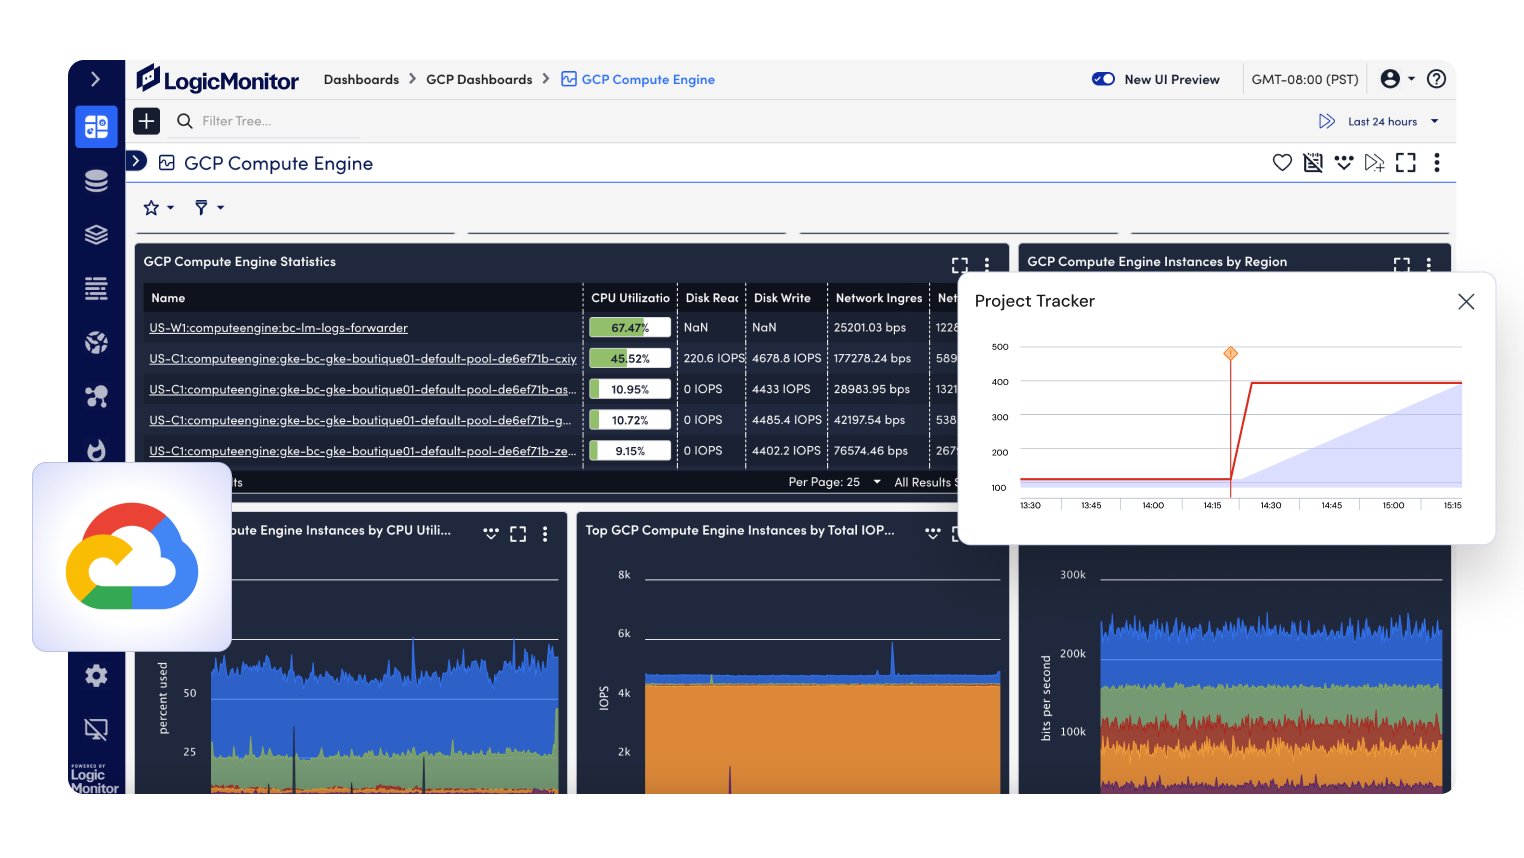
Giám sát Google Cloud Platform
Businesses can uniformly monitor Google Cloud services and data center infrastructure. As a result, IT teams can troubleshoot faster and reduce unnecessary alerts.
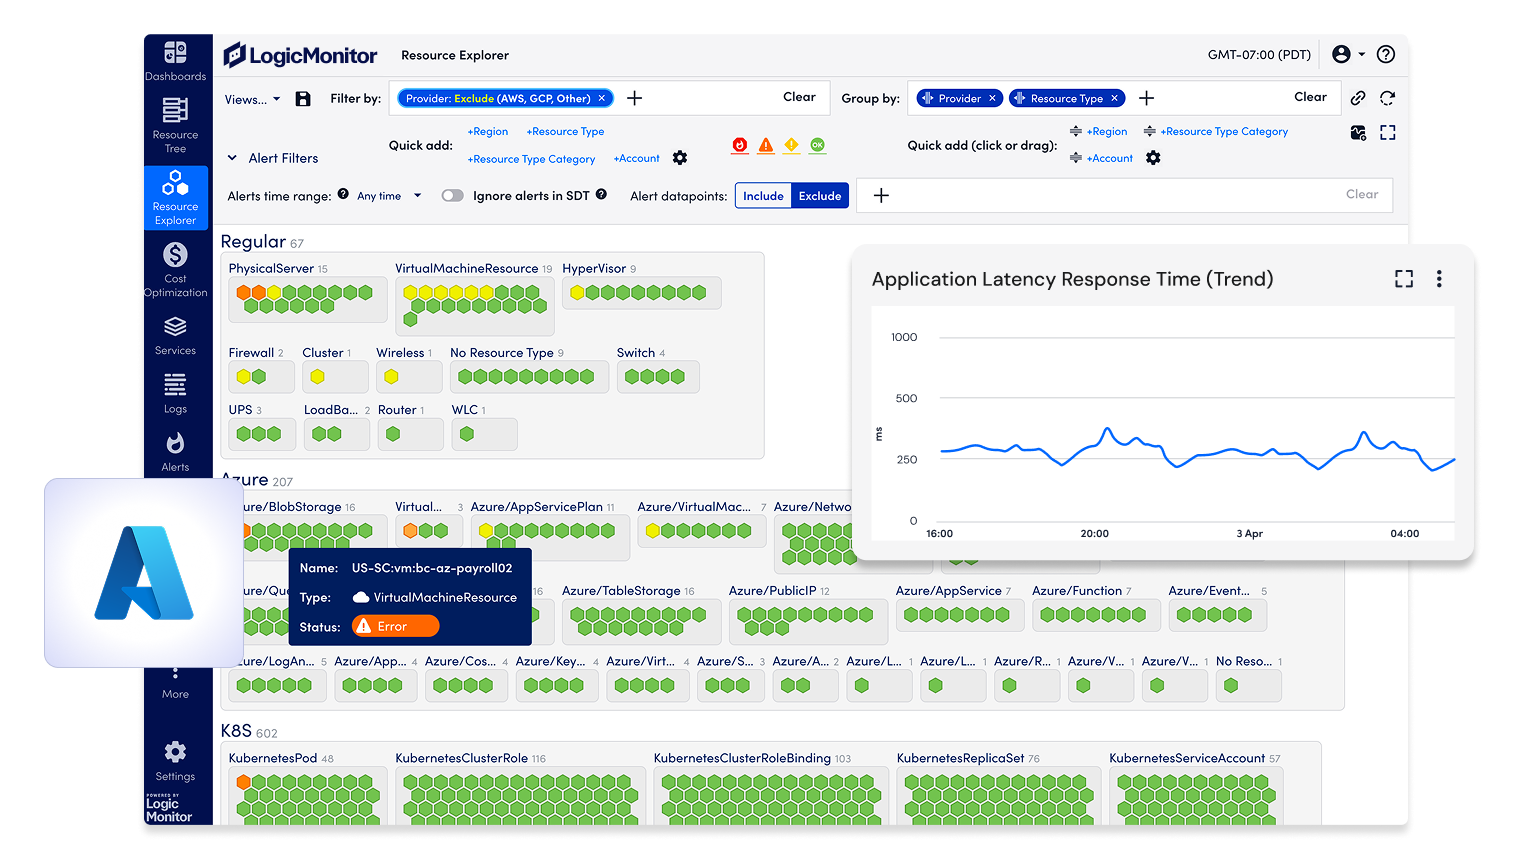
Giám sát Azure
LogicMonitor automatically discovers Azure resources. The solution synchronizes metrics between on-premises and multi-cloud environments. Additionally, AI-powered intelligent alerts help resolve issues faster.
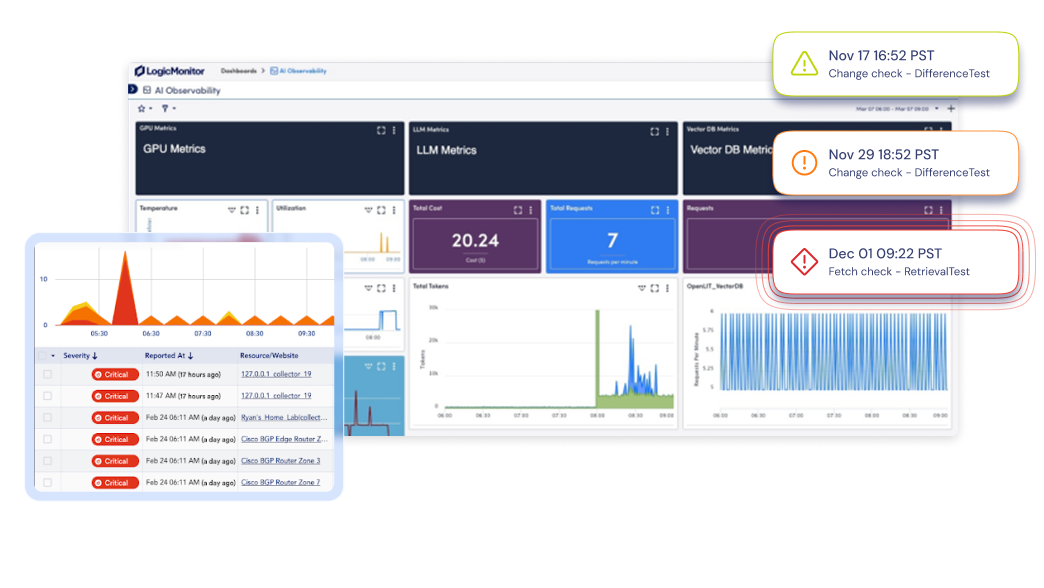
AI infrastructure and workload monitoring
LogicMonitor supports monitoring of infrastructure, workloads, and AI processes on a single platform. This helps enterprises make data-driven decisions instead of only reacting when incidents occur.
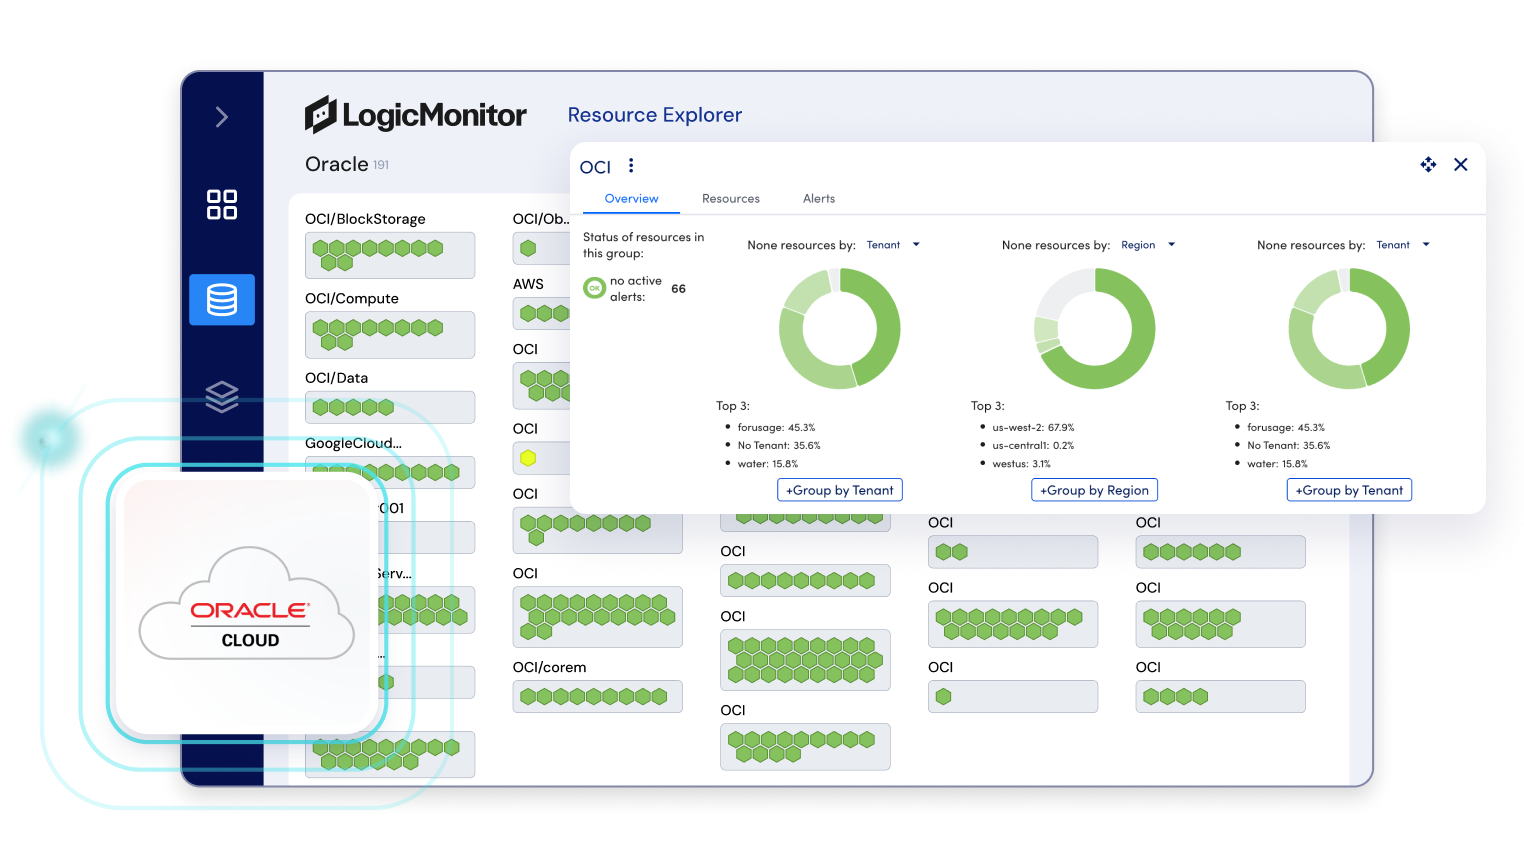
Giám sát Oracle Cloud Infrastructure
LogicMonitor helps increase OCI resource visibility. The solution also synchronizes metrics and narrows the gap between cloud resources and hybrid resources.
Benefits of cloud monitoring with LogicMonitor
LogicMonitor helps enterprises monitor performance across AWS, Azure, GCP and OCI along with on-premises infrastructure. All data is displayed on a single platform.
This is a critical factor for organizations implementing cloud migration or operating multi-cloud. Enterprises can detect anomalies, evaluate performance and clearly see system status after migrating to cloud.
The solution also supports AI workloads running on Azure Machine Learning, Amazon Bedrock or GPU EC2. With automatic new resource discovery capabilities, enterprises can monitor systems as workloads grow or change.
Beyond performance, LogicMonitor also supports cloud cost optimization. Enterprises can identify inefficiently used resources, detect over-provisioning, and budget cloud spending more intelligently.
Log management in IT system monitoring with LM Logs
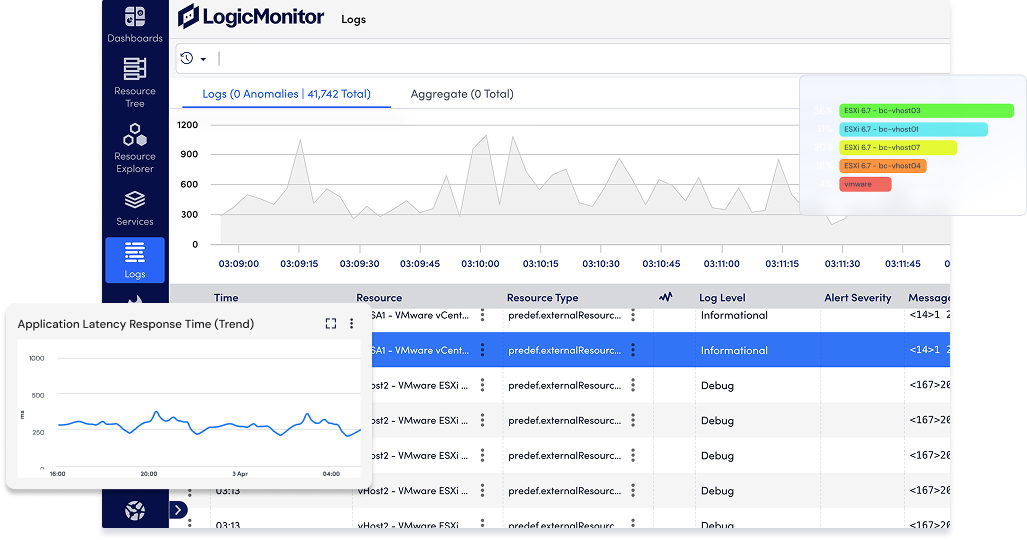
In modern systems, logs are an important data source for incident investigation. However, large and distributed log volumes often make the analysis process slow.
LogicMonitor's LM Logs modernizes log management. The solution integrates logs with infrastructure metrics and uses intelligent algorithms to detect anomalies.
As a result, IT teams can analyze root causes faster. They also do not need to constantly switch between multiple monitoring tools and log tools.
Key highlights of LM Logs
Centralized data:
Logs and metrics are consolidated on a single platform. This helps technical teams investigate incidents more easily.
AIOps anomaly detection:
LM Logs leverages automation and machine learning to detect anomalies. The solution also supports trend discovery and identification of system baseline states.
Unified monitoring experience:
The solution is built for ITOps and DevOps. LM Logs helps aggregate logs, integrate AI and enhance usability.
Main features of LM Logs
Comprehensive and scalable log collection
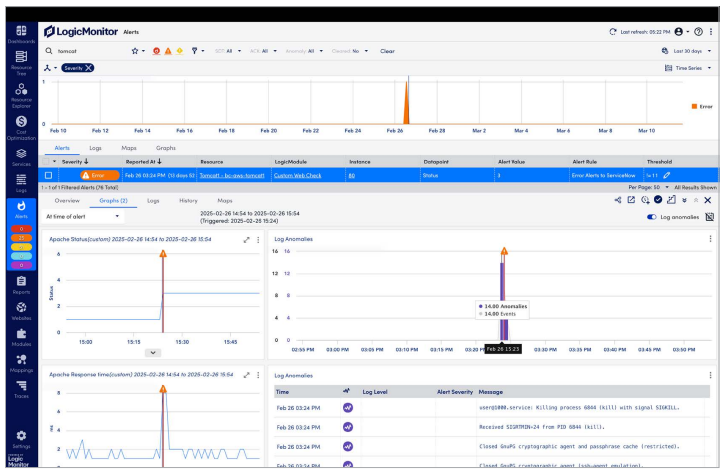
Built-in integrations make sending logs to LogicMonitor simple. Logs are automatically matched with monitored resources. Anomalies are also detected and displayed in context.
Powerful API
Enterprises can customize log collection. They can also send any type of log to LogicMonitor, even without pre-built integrations.
Correlated log alerts
LogicMonitor supports alert conditions based on regular expression patterns. This feature helps detect events or anomalies in logs and send appropriate alerts.
Streamlined investigation process
LM Logs correlates logs with metrics and alerts. This enables IT teams to troubleshoot issues in applications, infrastructure and networks faster.
Flexible storage
LM Logs provides storage options of 30 days, 90 days, and 1 year. All log data is in hot storage. Enterprises can access it when needed without having to re-import data.
Custom search and filter
Users can search by keyword or perform complex queries. They can also filter logs by resource, resource group or time range.
Benefits of LM Logs
LM Logs helps enterprises consolidate logs and metrics on one platform. Anomalies are detected using machine learning. This suits different user levels.
Instead of spending time manually filtering logs, IT teams can focus on anomalies directly related to IT operations. This helps reduce context switching time and shorten incident response processes.
AIOps in IT system monitoring with Edwin AI
Organizations today must maintain more stable services while operating budgets are increasingly optimized. At the same time, the number of alerts is growing rapidly. Fragmented workflows also make IT teams prone to overload.
Edwin AI is LogicMonitor's advanced AI agent for IT operations. Unlike traditional tools that only provide alerts, Edwin AI is designed to simplify and accelerate the incident resolution process.
Edwin AI improves visibility across multiple systems. The solution provides AI-based insights and helps IT teams troubleshoot more effectively.
With an Agentic AIOps approach, Edwin AI can proactively analyze, make decisions, and support actions to resolve incidents.
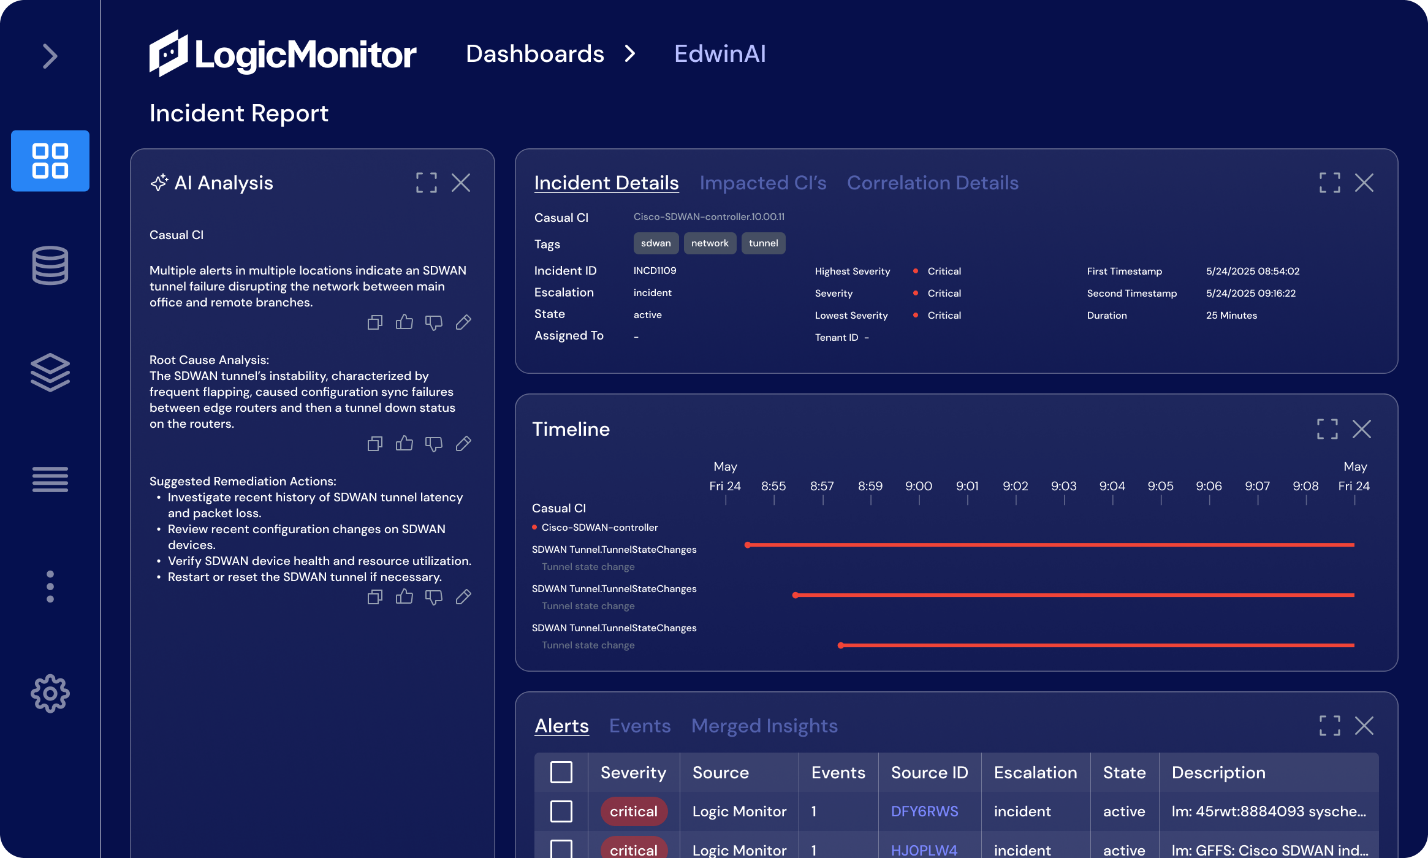
Key highlights of Edwin AI
Transform IT operations with agentic AI
Edwin AI doesn't just provide data. The solution correlates alerts, identifies root causes and suggests remediation approaches. This enables IT teams to respond faster.
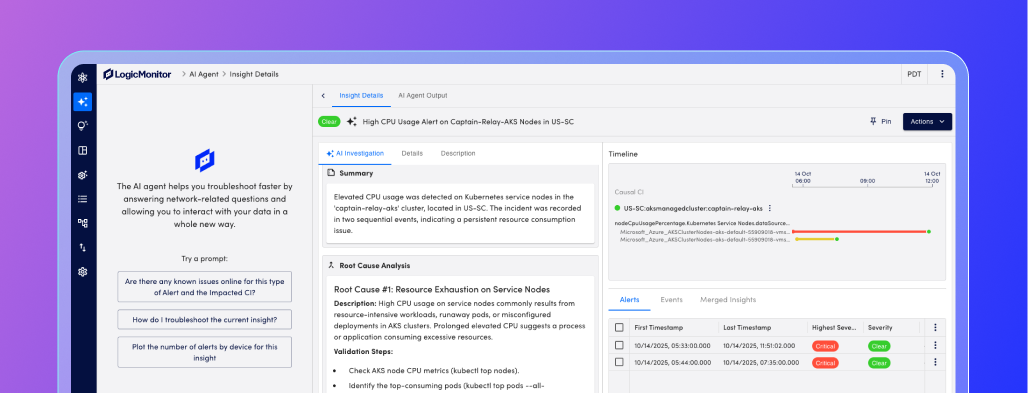
Specifically designed for IT Operations
Edwin AI is built for IT operations problems. The solution is not simply repackaging large language models.
Edwin AI uses Generative AI to provide information that is easy to understand, actionable and close to natural communication.
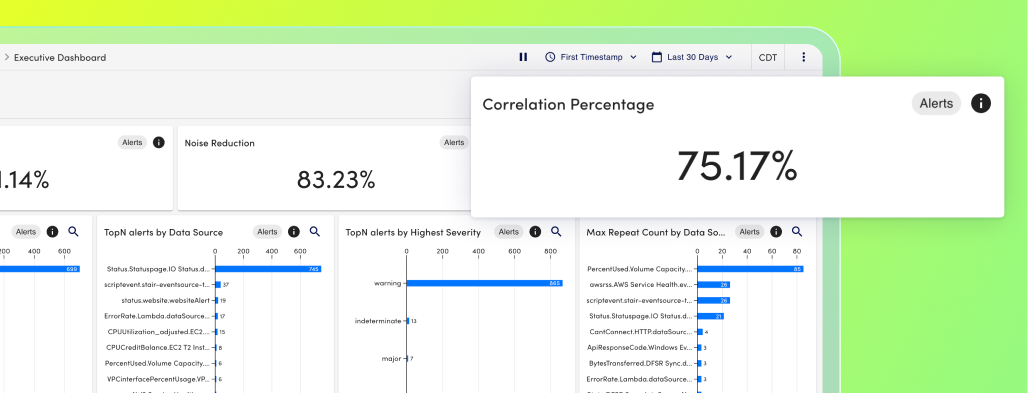
Understand context from hybrid data
Edwin AI combines operational data with system context. As a result, the solution can identify patterns and relationships that operators might overlook.
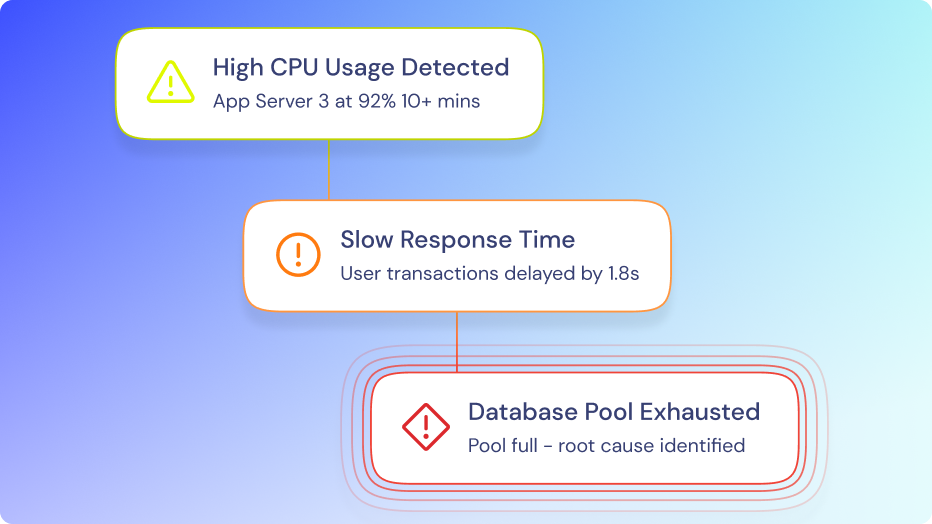
Transparent and configurable
LogicMonitor emphasizes explainable AI capabilities. IT teams can understand the reasoning behind the insights Edwin AI provides. They can also configure the system according to operational needs.
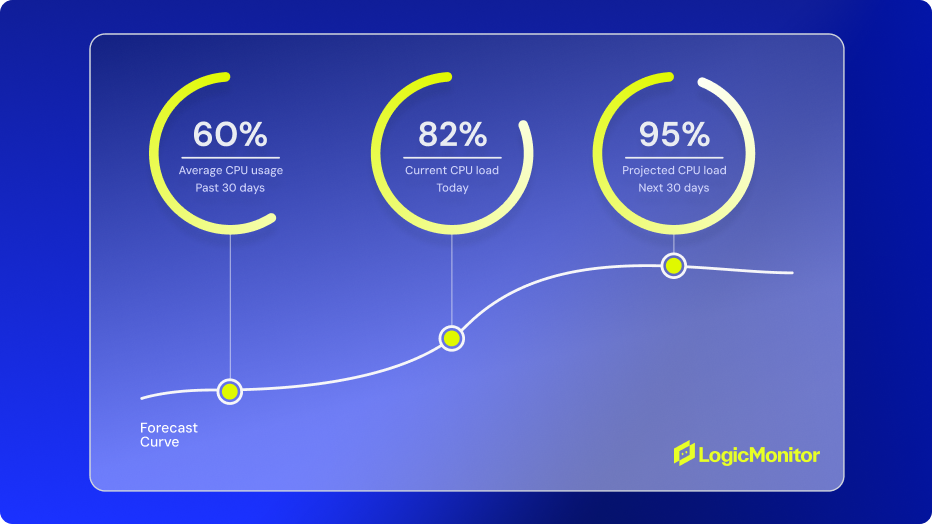
Create value quickly
Edwin AI can be deployed quickly and does not require lengthy training. The solution provides real-time summaries and automatically correlates alerts from the early stages.
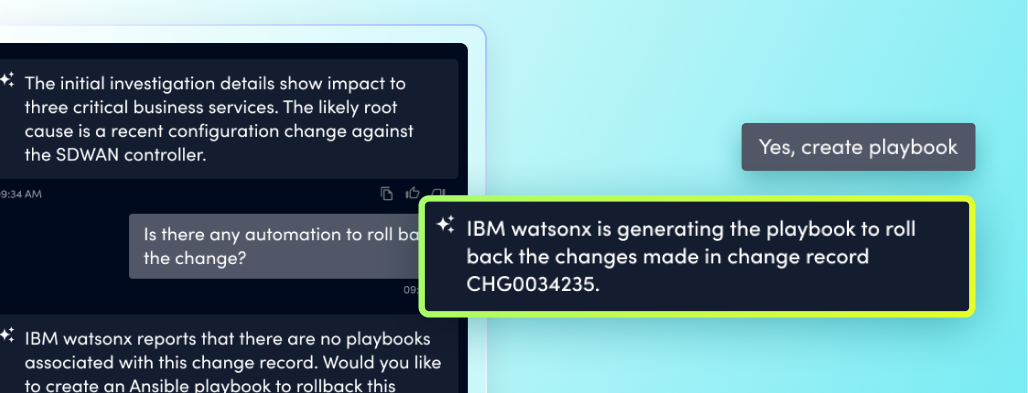
Key features of Edwin AI
Edwin AI – Event Intelligence
This is LogicMonitor's foundational AIOps layer. This feature helps enhance IT operational efficiency.
Notable capabilities include:
- Reduce alert noise by up to 80%.
- Two-way synchronization with ITSM systems.
- Connect with over 3,000 tools and systems.
- Automatically classify and identify alert patterns using AI Tags.
- Open model, configurable according to business requirements.
Edwin AI – Next-generation AI agent
Advanced AI layer helps enterprises enhance AIOps with capabilities:
- Generate alert titles and summaries using AI.
- Translate complex alerts into understandable language.
- Root cause analysis based on data.
- Recommend remediation actions step by step.
- Predict incidents before they impact the business.
- Conversational interaction to exploit context, history and processing guidance.
Benefits of Edwin AI in IT operations
Edwin AI integrates seamlessly with existing IT ecosystems. With over 3,000 integrations, the solution can group related alerts across on-premises infrastructure, hybrid cloud, and third-party systems.
LogicMonitor can also consolidate data from observability, security, and APM tools. Examples include Datadog, Splunk, CrowdStrike, and CMDB data from ServiceNow.
Another notable benefit is the ability to reduce alert noise. Edwin AI can compress up to 80% of alerts. This helps reduce alert fatigue and ensures critical issues are not overlooked.
As a result, IT teams can spend more time on strategic initiatives. They no longer have to handle too many repetitive alerts every day.
Monitor IT systems from a digital user experience perspective
Application performance is not just a story of servers, databases or APIs. In the digital environment, end-user experience directly impacts business effectiveness.
Digital Experience Monitoring – DEM is part of Observability. DEM focuses on monitoring, analyzing, and optimizing real user experience on websites, applications, and digital services.
Unlike traditional infrastructure monitoring, DEM measures performance from the end-user perspective. This helps enterprises better understand the impact of IT systems on customers, employees, and business operations.
The role of Digital Experience Monitoring
DEM helps businesses ensure seamless user experience. The solution combines real user monitoring, synthetic testing and advanced analytics.
DEM also helps bridge the gap between DevOps and ITOps. Teams can view a unified dataset together. As a result, they coordinate better when addressing performance issues.
How does DEM work?
Data Collection
DEM collects data from multiple sources. These sources include Real User Monitoring, synthetic monitoring, application logs, and network performance metrics.
Data reconciliation
Data from multiple sources is linked to create a comprehensive end-to-end view of the digital experience.
Performance analysis
The solution uses advanced analytics and machine learning. This helps identify patterns, anomalies, and root causes of performance bottlenecks.
Information visualization
DEM provides dashboards and visual reports for each team. DevOps can focus on the application layer. ITOps can monitor overall infrastructure health.
Proactive alerts
Comprehensive monitoring and threshold-based alerting help detect incidents before users are actually affected.
Collaboration support
DEM creates a unified data source for technical teams to analyze together. This helps optimize performance and reduce incident resolution time.
Key components of DEM
Real User Monitoring – RUM
RUM collects data from real user interactions with websites or applications. This technology measures page load times, transaction times and error rates.
Comprehensive transaction monitoring
Synthetic transaction monitoring simulates critical user journeys. Examples include login, purchase, or product search. This helps detect errors early before they affect real users.
Giám sát endpoint
Endpoint monitoring tracks the performance of end-user devices. These devices include computers, laptops, and mobile devices.
Application Performance Monitoring – APM
APM monitors backend performance, APIs, databases and servers. This feature helps detect issues at the application level.
Network monitoring
Network monitoring tracks latency, bandwidth and packet loss. These are factors that directly affect digital experience.
Session replay
Replay recorded sessions and reconstruct user journeys. This feature helps IT teams analyze behavior and diagnose complex issues.
Effective DEM deployment strategy
For DEM to deliver value, enterprises should start with user-centric objectives. Metrics such as page load time, transaction errors, network latency and response time need to be prioritized.
Enterprises should also integrate DEM with APM, network monitoring, and log management. This creates a unified view of the digital ecosystem.
Continuous feedback loops also need to be established. Enterprises can use monitoring data to improve application code, network infrastructure, and user interfaces.
Dashboards and reports need to be customized for each group. Technical teams need detailed data, while business teams typically need high-level KPIs to assess impact on customer experience.
Key DEM features of LogicMonitor
SaaS application monitoring
LogicMonitor helps ensure tools like Microsoft 365, Zoom and Slack always operate stably. This helps protect employee work productivity.
Giám sát website
Solution that tracks availability, performance and customer experience. This enables enterprises to proactively detect and resolve issues.
Application performance monitoring
LogicMonitor provides intelligent correlation between traces, metrics, and synthetic results. This enables faster incident detection and maintains seamless digital experiences.
Third-party organization assessments
Reference LogicMonitor reviews on Gartner Peer Insights:
https://www.gartner.com/reviews/market/infrastructure-monitoring-tools/vendor/logicmonitor
Refer to LogicMonitor reviews on G2:
https://www.g2.com/products/logicmonitor/reviews
Why choose LogicMonitor for IT system monitoring?
LogicMonitor is suitable for enterprises requiring a modern monitoring platform. The solution is scalable and suitable for complex hybrid IT environments.
LogicMonitor helps enterprises:
- Consolidate infrastructure, cloud, log, application and digital experience monitoring.
- Reduce dependence on multiple discrete monitoring tools.
- Early detection of anomalies and service disruption risks.
- Accelerate root cause analysis.
- Reduce alert noise with AIOps.
- Optimize cloud resources and costs.
- Improve MTTR and operational efficiency.
- Enhance end-user experience.
- Support IT teams to operate more proactively in the AI era.
With LogicMonitor, IT system monitoring does not stop at device status tracking. Enterprises can observe the entire infrastructure, analyze operational data, and proactively handle incidents.
Sonic provides LogicMonitor solution in Vietnam
LogicMonitor solutions are now part of the technology solution ecosystem provided by Sonic Technology Solutions Joint Stock Company – Sonic Tech in Vietnam.
With experience in consulting, deploying, and providing technical support for IT and cybersecurity solutions, Sonic is ready to accompany enterprises throughout the evaluation, testing, and deployment process of LogicMonitor.
Enterprises interested in IT system monitoring, LogicMonitor LM Envision, Observability, cloud monitoring, log management, Edwin AI or Digital Experience Monitoring can contact Sonic for detailed consultation.
👉 Learn more about other cybersecurity solutions at:
https://sonictech.com.vn/
👉 Official website of LogicMonitor: https://www.logicmonitor.com/
————————–